Explore warm nights and heat waves with the Extreme Heat Tool on Cal-Adapt
The Extreme Heat Tool on Cal-Adapt has always been one of our most visited tools. This week we are excited to roll out some new visualizations and functionality we have added to our Extreme Heat Tool. A quick list of the major changes are below.
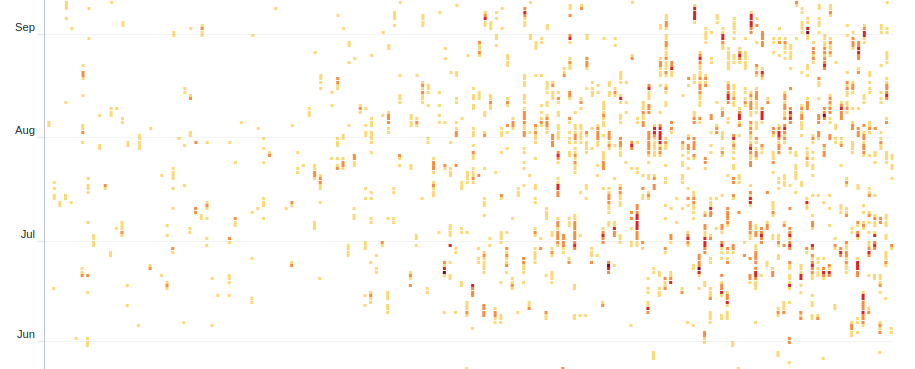
Explore projections for Warm Nights
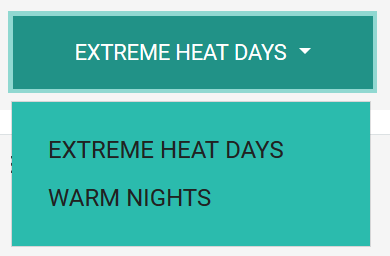
Minimum nighttime temperatures are also predicted to increase in California. In addition to the Extreme Heat Days, you can now see explore the frequency, timing and duration of Warm Nights. Select Warm Nights by clicking on the drop down select box.
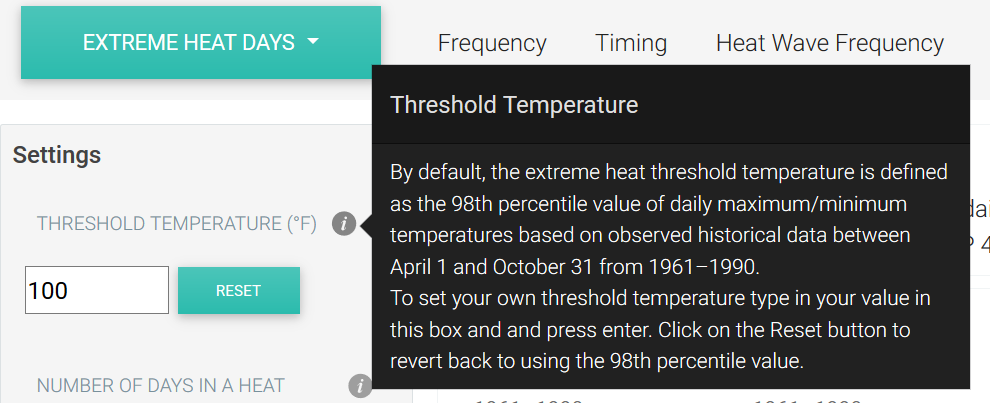
The tool utilizes LOCA downscaled daily maximum and minimum temperatures to calculate Extreme Heat Days and Warm Nights respectively. For purposes of this tool, an extreme heat day or warm night is defined as a day in a year when the daily maximum/minimum temperature exceeds the 98th historical percentile of daily maximum/minimum temperatures based on observed historical data from 1961–1990 between April and October.
Explore Heat Waves
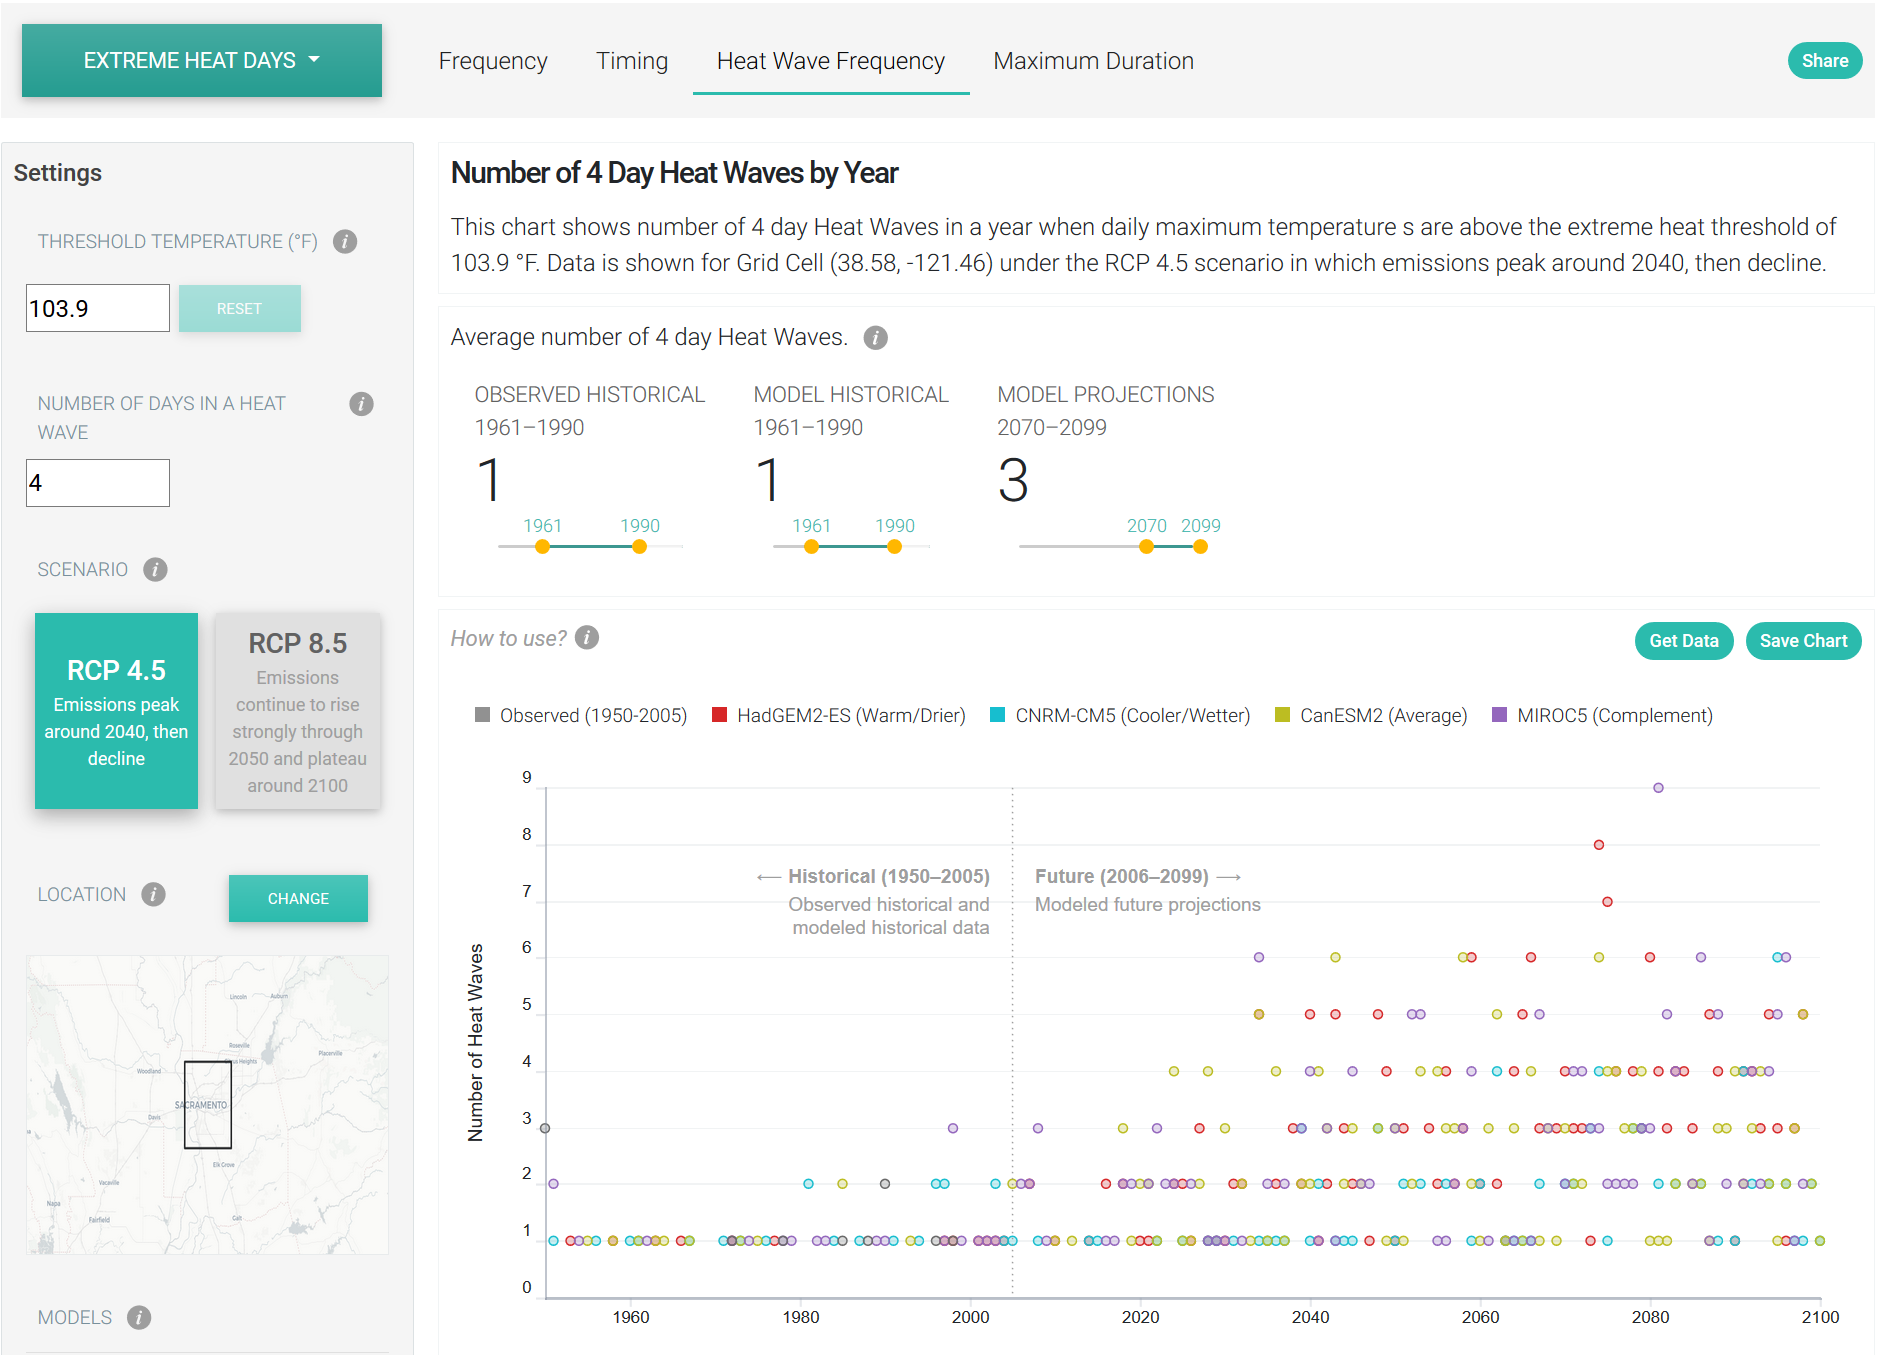
Heat waves are characterized as periods of sustained, extreme heat, although there is no universal definition of a heat wave. For purposes of this tool, a heat wave is defined as a period of 4 consecutive extreme heat days or warm nights when the daily maximum/minimum temperature is above the extreme heat threshold. Each 4 day/night period is counted, so that if extreme temperatures persist for 10 consecutive days/nights, it counts as 2 Heat Waves.
Use your own values for Temperature Threshold and Number of Days in a Heat Wave
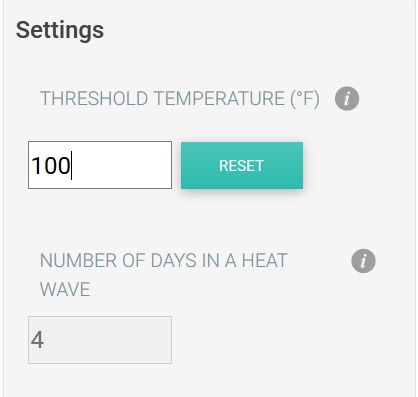
In many sectors a specific threshold temperatures or heat wave period may be used for assessing impacts of extreme heat events. In response to several user requests we have added the functionality for users to set their own custom temperature threshold and/or Number of Days/Nights in a Heat Wave. Type in a new value in the corresponding Input Box and press the Enter key. The visualizations should update automatically. Click on the Reset button to use the 98th percentile value for Temperature Threshold.
Highlight Data for a Model
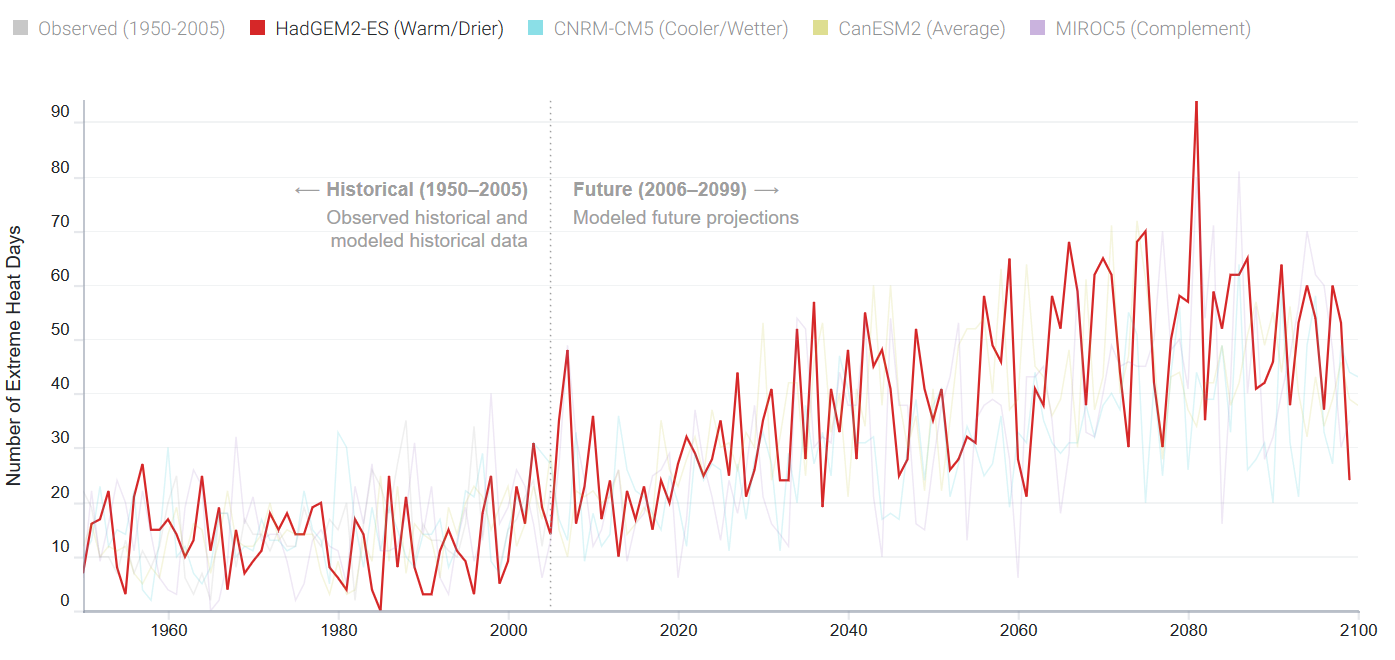
By default, the Extreme Heat Tool loads projections for four LOCA downscaled GCMs. These models have been selected by California’s Climate Action Team Research Working Group as priority models for research contributing to California’s Fourth Climate Change Assessment. Projected future climate from these four models can be described as producing:
- A warm/dry simulation (HadGEM2-ES)
- A cooler/wetter simulation (CNRM-CM5)
- An average simulation (CanESM2)
- The model simulation that is most unlike the first three for the best coverage of different possibilities (MIROC5)
You can load data for additional GCMs by checking the corresponding box in the Settings Panel on the left of the tool. You can highlight data for a particular GCM by clicking on the model name in the legend. Clicking on the name again will remove the highlight. Highlighting one GCM at a time can help in comparing the different model outputs across time.
Information Popups
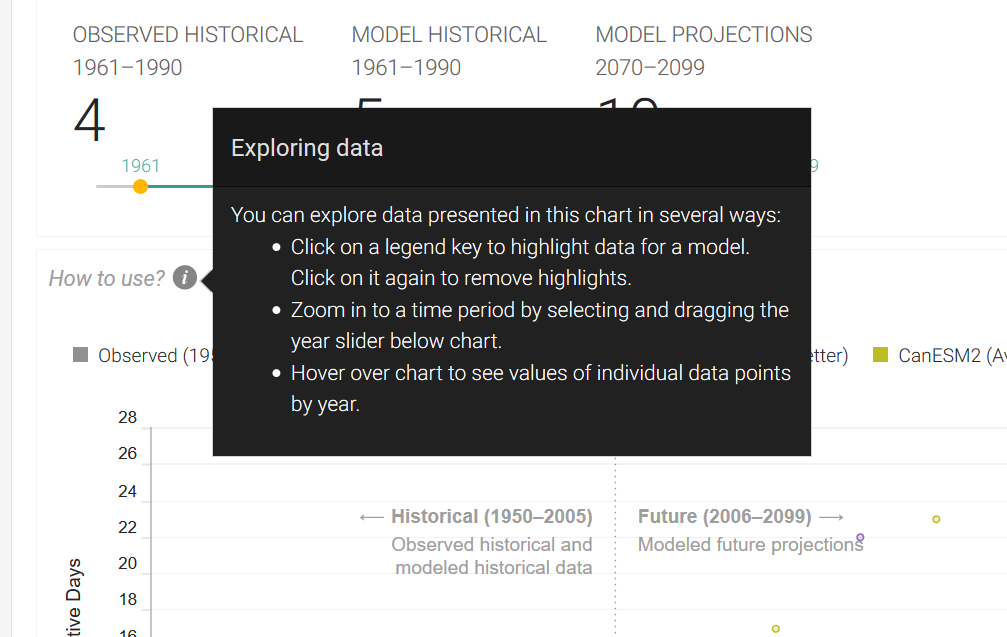
We have added several ![]() icons throughout the tool that provide additional context. Hover over the icon to see a popup with more information.
icons throughout the tool that provide additional context. Hover over the icon to see a popup with more information.
Feedback
We would love to hear from you! Please send us your feedback on the new updates to the Extreme Heat Tool at support@cal-adapt.org. If you are interested in exploring the data more interactively, download this Jupyter Notebook and open it in your own Python environment to get started.